
California, the home of Silicon Valley and more billionaires than any other state, is the poorest state in the country.
That’s according to an Oct. 16 report from the Census Bureau, which also finds that Mississippi – typically ranked among the poorest states – has a poverty rate below the national average.
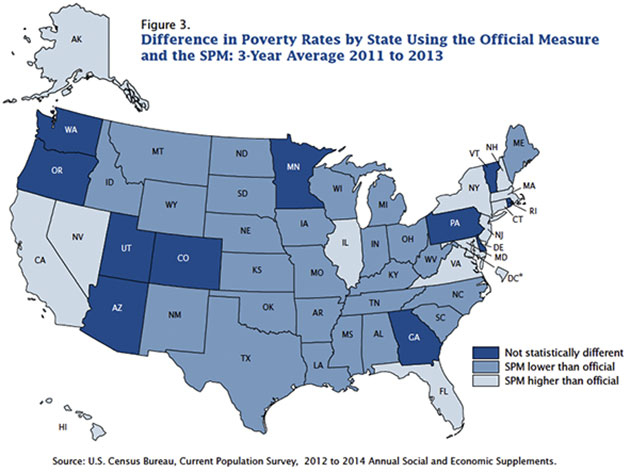
The report out last week is not the official census poverty measure, which came out a month earlier. But after decades of criticism that the official measure is broken and outdated, federal officials in 2011 began quietly piloting an alternative approach to measuring poverty.
Called the Supplemental Poverty Measure (SPM), the report has no official bearing on policy. The latest SPM report puts the 2013 national poverty rate at 15.5 percent, one point higher than the official measure. But the regional differences are dramatic, upending some long-held notions about the distribution of poverty in the U.S.
Those notions are based largely on the official poverty measure, a formula that has changed little since the 1960s.
“It is antiquated,” said Mark Levitan, the former director of poverty research for New York City, which in 2008 threw out the official federal measure and devised an alternative for city poverty reports.
But for the most part, nonprofit organizations, community groups and the private charity world continue to rely on the official statistics.
“Since the SPM data are relatively new (at least, newly released), I suspect that not many nonprofits use it,” Carol J. De Vita, senior fellow at the Urban Institute’s Center on Nonprofits and Philanthropy, said in an email.
There’s little comprehensive data on which measure private charities use, but De Vita notes that nonprofit groups operating a government-funded program such as Head Start must follow government-proscribed eligibility definitions. But, she said: “If the nonprofit is creating a program on its own, then it is free to use whatever measure of poverty it likes.”
So should more nonprofit and community groups be using the new supplemental measure?
To understand the official measure’s limitations — and how it can be used as a political weapon against anti-poverty programs — it’s important to understand how the official measure works.
A Broken Yardstick?
Simply put, the official measure sets a single national poverty threshold by multiplying the cost of a basic subsistence diet by three, adjusting for family size and updating annually for inflation.
Last year, for a family of two adults and two children, the official poverty threshold was roughly $23,600.
That is regardless of whether the family lived in Cheyenne, Wyoming or in San Francisco – where average housing costs run 225 percent higher than Cheyenne, according to a comparison tool from CNNMoney.
In addition to the lack of regional adjustments, experts point to two critical flaws with the official measure. The first is a simple anachronism in household economics. When the formula was created in the 1960s, roughly a third of the average family budget went toward food.
But advances in agricultural technology have made food relatively cheaper, while skyrocketing housing and health care costs have become bigger strains on many low-income household budgets.
Recent estimates from the Bureau of Labor and Statistics put the average household food spend at 16 percent of the family budget for the bottom quintile of wage earners. The same group spends 40 percent of their income on housing – a massive share of household budget, but not that much higher than the 33 percent average share that Americans in all income brackets devote to housing.
The second issue with the official measure is subtler. It defines income strictly as pre-tax wages. This means that assistance programs such as tax credits and food stamps have — by definition — no direct impact on official poverty levels.
A family benefiting from housing tax credits or subsidized health insurance looks as destitute on paper as another family with the same gross income and no access to the same programs.
Opponents of those programs frequently use that fact to attack anti-poverty programs, on the grounds that they aren’t making a dent in official numbers. In March, Congressman Paul Ryan issued a blistering report on social assistance programs titled, “The War on Poverty: 50 Years Later.”
“Right now, the federal government spends nearly $800 billion a year on 92 different programs to fight poverty,” Ryan, a Republican from Wisconsin, said in remarks introducing the report. “Yet the official poverty rate is the highest in a generation.”
But only five of the U.S. government’s 92 anti-poverty programs are cash-based. Over 70 percent of the $800 billion spent fighting poverty goes to non-cash programs. That assistance doesn’t show up in official numbers at all.
A Different Approach
The Supplemental Poverty Measure aims to bridge that gap by counting food stamps, tax refunds and other public assistance toward a family’s income, illuminating the impact of such programs. The SPM report found, for example, that 23 percent of children would be living in poverty if refundable tax credits were eliminated, as opposed to the current supplemental rate of 16 percent.
The SPM also offers a dramatically different geographic picture of poverty. Mississippi, which has one of the highest poverty rates under official measures, drops below the national average in the SPM. By contrast, California’s poverty rate jumps from 16 percent under the official measure to 23 percent — making the Golden State the poorest in the country under the new measure.
 With its headquarters located in the Silicon Valley city of Mountain View, California, Google is one of the most successful and innovative technology companies in the world. If the Census Bureau’s Supplemental Poverty Measure definition is followed, its employees work in the hardest-hit US state in terms of poverty. (Photo: bubbletea)The differences at the state level are due mainly to regional variations in housing costs, according to Kathleen Short, the Census Bureau economist who authored the latest SPM report.
Choosing The Right Measure
Despite its advantages as a statistical tool, the SPM is unlikely to replace the official poverty measure. For one thing, as Short pointed out, it would be “circular logic” to count food stamps as income when setting eligibility thresholds for food stamps.
But even regional cost-of-living adjustments to the official measure face a seemingly impossible hurdle in Congress. Because billions in federal funding to the states are tied to state poverty levels, any change to the official formula would likely divert dollars from states like Mississippi to places like California.
New York City’s revised poverty definition, for example, found that 46 percent of its residents were at or near poverty, versus 31 percent under the official measure, according to the most recent of the reports.
“There would be winners and losers,” Levitan, the poverty expert from New York City who teaches at Hunter College, said of changes to the official poverty measure. “Going down that road would create a real political donnybrook in Congress.”
Groups and organizations that aren’t reliant on government funds can focus on the SPM.
“Overall, research finds that the poverty thresholds under SPM are slightly higher than under the traditional measure,” De Vita of the Urban Institute said. “This means that more people would be eligible for poverty programs and services.”
“The adjustment that the SPM makes for geographic location, especially as it relates to housing costs, can be an important factor for nonprofits that provide or support place-based programs and services,” she said.
Because it accounts for health care costs, the supplemental measure may be particularly useful for groups that focus on older populations, which typically have higher average health care costs, De Vita added.
The SPM also uses a broader definition of households, including same-sex couples with children.
In future years, Short, the economist at the Census Bureau, hopes to release the supplemental report in tandem with the official poverty report. That would give policy makers, researchers and the public a more complete picture of poverty in one shot.
“The official poverty measure gets a lot of criticism from many quarters,” she said. “There are a lot of ways we could improve, to get a closer look at families in poverty, and better understand the difficulties they’re going through.”
Join us in defending the truth before it’s too late
The future of independent journalism is uncertain, and the consequences of losing it are too grave to ignore. We have hours left to raise the $12,0000 still needed to ensure Truthout remains safe, strong, and free. Every dollar raised goes directly toward the costs of producing news you can trust.
Please give what you can — because by supporting us with a tax-deductible donation, you’re not just preserving a source of news, you’re helping to safeguard what’s left of our democracy.