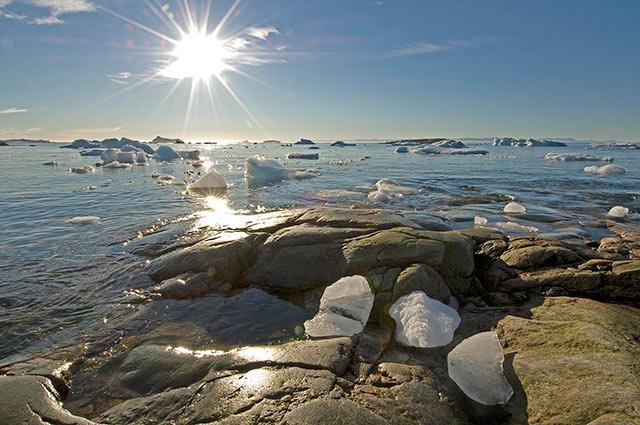
Climate science is way out in front of climate policy. Commitments at the United Nations Climate Conference in Paris pale in comparison to those from the Kyoto Protocol with its beginnings in the Rio Earth Summit in 1992. The cheap and unambiguous solution of removing CO2 directly from the sky has been discredited by the perceived debate. Previously assumed stable ice sheets are disintegrating. It is warmer than any time in the last 120,000 years. The Gulf Stream appears to be shutting down. Nearly 100 submarine glacial valleys beneath the Greenland Ice Sheet tunnel warm subtropical Atlantic water 90 miles beneath the ice. The Intergovernmental Panel on Climate Change (IPCC) says we need to remove more carbon dioxide from our atmosphere than we emit every year (negative emissions). Most importantly, new knowledge about global cooling smog shows that killing coal will create more warming than doing nothing in the most critical decades-long time frames.
The great delay in climate action has dramatically increased climate change impacts and the amount of carbon dioxide that we must now deal with to prevent even greater impacts. Delay has been caused by the debate casting doubt on climate science in ways that have proven to be effective in similar debates about smoking, acid rain and ozone-depleting chemicals. Because of doubt, fundamentally important new climate science has failed to escape the confines of academia and proceed into the public realm where it can move policy – literally – into the 21st century.
Number One: Direct Air Capture
Not new, very real, but often maligned in advocacy and policy discussions, direct air capture (DAC) of carbon dioxide is an important aspect of the failure of traditional climate science education techniques. DAC costs as little as $20 per ton, and once fully industrialized, can remove 50 ppm CO2 from the atmosphere and allow us to approach a safe level of greenhouses gases for less than the $2.1 trillion Americans spent on health care in 2006. (1, 2)
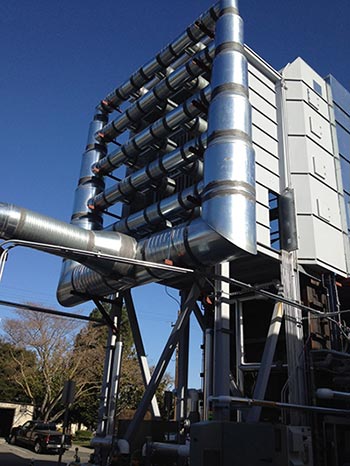 Global Thermostat’s pilot project can remove 100,000 tons of carbon dioxide per year for $10 per ton. (Photo: Global Thermostat)Is removing CO2 directly from the atmosphere bad because it will give us incentive to continue burning fossil fuels with all of their other problems? No. Risks from climate change, especially from abrupt change, involve hazards that threaten our civilization. If these risks can be addressed independently from complicated sociological, health and environmental issues associated with fossil fuels, most of the other issues would be moot. We will eventually solve these other problems. But right now, after a generation of delay, we waste even more time attempting to solve all of these other problems when the simple solutions are at hand.
So why is DAC so often discounted? A report by the American Physical Society (APS) in 2011 claimed DAC economically infeasible. Because of the ability of DAC to be exceedingly effective, media coverage of this report was widespread. What was not covered in media reporting: the report only considered WWII era technologies, the prestigious journal Nature published a rebuttal identifying the APS omissions and the co-author of the APS report is “a distinguished adviser within British Petroleum [BP].” (3)
Current Policy Is Less Stringent Than 1992 Kyoto Protocol and Negative Emissions
The US commitment at the UN Climate Conference that concluded this month in Paris was for 80 percent emissions reductions below 2005 levels by 2050. Commitments for developed nations under the Kyoto Protocol were 80 percent below 1990 levels by 2020. (4) The current US commitment is 27 percent less with a 30 year delayed target.
 The Kyoto Protocol originated with the United Nations Conference on Environment and Development, also known as the Rio de Janeiro Earth Summit, in 1992 and their current greenhouse gas commitments were adopted in 1997. The US was the only party to the never ratify Kyoto that did not sign the original UN treaty. (Photo: CC)Research this fall tells us that if the EU, US and Chinese commitments from the UN Climate Conference in Paris in 2015 are honored, all other countries would have to a commit to climate pollution mitigation seven to 14 times more aggressive than the EU, US and China, to avoid 2 degrees Celsius of warming by 2030. (5)
To get there from here, the 2013 IPCC has made a rare policy statement that plainly states the obvious in that we must create “strong negative emissions.” (6) Put another way, we must remove “strongly” more CO2 from our atmosphere than we emit every year. But when the IPCC closed for new papers, research was not robust enough to talk about the amount of negative emissions.
New work from the France, Japan and Great Britain institutes of sciences and meteorology have new modeling that reveals the true challenge of keeping warming below 2 degrees Celsius. Under the best case scenario, negative emissions of 135 percent of annual emissions are required. For the worst-case scenario that we are currently tracking, negative emissions of 210 percent of annual emissions are required. (7, 8)
It’s only logical that delay means that climate policy should be more stringent, not less stringent.
New Science Turns 20 Years of Policy on Its Head: Net Warming
It only makes sense that policy would include all factors contributing to climate change – both warming and cooling – but until recently we have not had the knowledge to understand global cooling pollutants. Because of the risks from small amounts of warming, scientists suggested warming pollutant emissions reductions action a generation ago. Now we have the knowledge to understand the other half of the story.
 Beijing, China smog comparison 2005. Global cooling sulfates emitted from burning fossil fuels are a primary component of smog. (Photo: Bobak, CC)The IPCC says that 57 percent of warming that should have already occurred has been masked by global cooling sulfates (smog) emitted mostly from burning coal. (9) Because so much sulfate pollution is created from coal, in the decades-long time frames where sulfates remain active in the atmosphere, stopping coal burning actually creates more net warming than doing nothing. (10)
This does not necessarily mean we must reverse a generation of efforts to control global warming, as coal is still the king of warming in the long-term. It simply means we must thoroughly evaluate current decades-old strategies in light of new knowledge or risk more warming than doing nothing.
Abrupt Change and the Decades-Long Time Frame: Greenland and the Gulf Stream
The Gulf Stream is one segment of a major global ocean current system. Water from the South Atlantic, Caribbean Sea and Gulf of Mexico join near Miami and flow north along the east coast of North America, then across the Atlantic to somewhere between Greenland and Finland before sinking to the bottom of the ocean to flow back south, around the Horn of Africa and east to the Pacific where it surfaces and flows back towards the Atlantic. Because of the Gulf Stream, Europe and northeastern North America have a much milder climate than other land areas at similar latitude.
For a decade or more now, the Gulf Stream has been considered stable enough that abrupt change caused by its shutdown was not a priority. Long-standing science implicated melting or disintegrating ice sheets as a significant trigger of abrupt change in the North Atlantic past but for now, the Gulf Stream was stable.
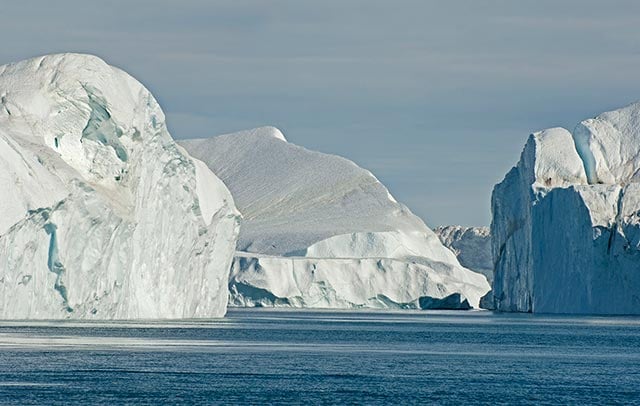 An iceberg armada disembarks from the mouth of the Ilulissat Icefjord in western Greenland. The Ilulissat Glacier (Jakobshavn Isbrae) drains 7 percent of the Greenland Ice Sheet. (Photo: Bruce Melton)
About 23 times in the last 100,000 years, Earth has experienced abrupt changes that originated with a shutdown/startup of the Gulf Stream due to iceberg discharge and melt in Atlantic sector of the Northern Hemisphere. This evidence is robust in bubbles of air in ancient ice from two mile deep Greenland ice cores and similar evidence from around the globe in numerous other lines of research dating back to the early 1990s. Changes of 9 to 15 degrees Fahrenheit across the globe and 25 to 35 degrees in Greenland happened in a century, or decades-long periods, or as little as several years. (11)
The theory is that freshwater melt from ice floats on salty sea water and creates a blockage in the warm northward flowing waters of the Gulf Stream. When the Gulf Stream shuts down, winter cold freezes the north Atlantic allowing cold air to penetrate much farther south, which has a reverberating cooling effect around the globe.
Sediment cores across the North Atlantic show layers that are full of sand and gravel that are far too heavy to have floated there from land. These layers are called ice rafted debris, have been delivered by iceberg armadas from purging of the North American and Greenland Ice Sheets, and coincide with most of the abrupt changes found in Greenland ice cores. (12)
In the recent past when science could not identify any changes in strength in the Gulf Stream and modeling could not reliably recreate abrupt changes, these events were not as worrisome as today. After all, the North American Ice Sheet was gone.
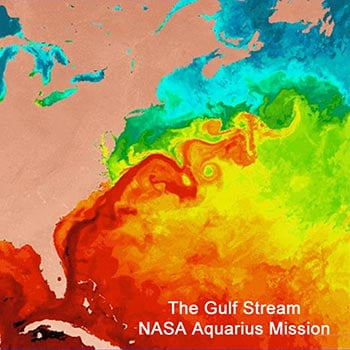 The Gulf Stream: without it Europe and northwestern North America would be in the deep freeze, or at least colder than present.This new research looks at eight years of Gulf Stream measurement from a new system of buoys, whereas previous work came from ships. Since the buoys went into operation there has been a large but varying 7 percent per year decreases in flow; well over a 50 percent total reduction. (13) It is still not clear if this is from climate change but other evidence is compelling.
Growth rings in deep sea corals off of Nova Scotia show a decisive shift in nitrogen source from cold to warm since the 1970s that is unique in 1,800 years. Nitrogen is a primary nutrient for coral growth and warm water nitrogen is distinctly different from cold water nitrogen. (14) Another compelling piece of evidence supporting a Gulf Stream shutdown caused by pooling melt water comes from the 2013 IPCC report that ice melt and discharge from Greenland has increased over 500 percent in the period between 2000 to 2009, with melt increasing since. (15)
The final and very unambiguous piece of evidence is the “global warming hole” over the North Atlantic. This research comes from Germany’s national science institute and actually shows the cold water melt from Greenland floating like a log jam in a river over the western North Atlantic, just south of Greenland. (16)
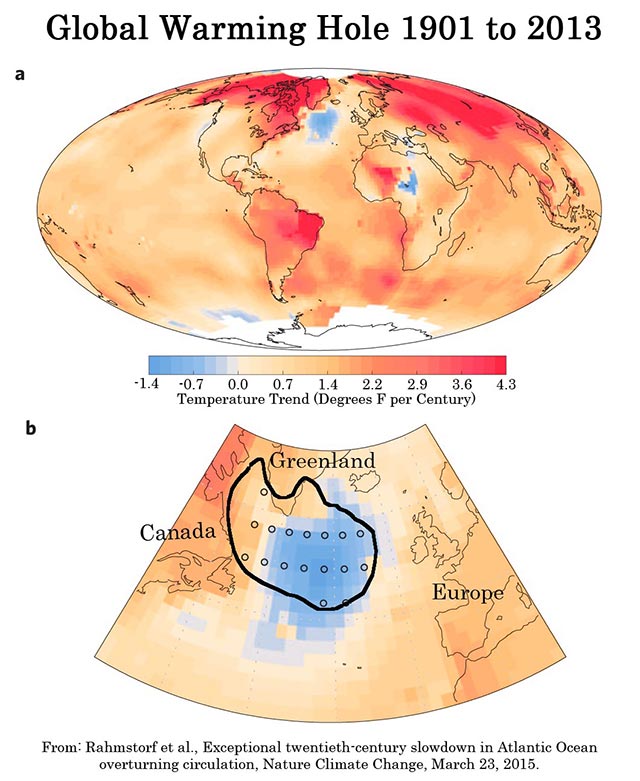 Greenland’s global warming hole shown in the average global temperature change from 1901 to 2013 (top). In the bottom image, the dark line and small circles are the modeled temperature response from an excess of fresh water from Greenland melt.
Abrupt change from Greenland melt now appears to be a real threat, not something to consider in the long-term future. Researchers have also finally been able to model a shutdown of the Gulf Stream for the first time in a hindcast from 30,000 to 50,000 years ago. This is a great coup for modeling and foretells a time in the hopefully near-term where we can predict these events and dramatically decrease uncertainty. (17)
The bottom line is that any more warming than we have already seen increases the risk that abrupt change will occur and the risk likely increases nonlinearly. Because current policy also allows what is called temperature overshoot, where emission reductions kick in gradually over time while warming continues, the only way to minimize overshoot is to do as the IPCC suggests and implement strong negative emissions.
Antarctic Collapse
Scientists have been warning us that the West Antarctic Ice Sheet disintegration has begun for 10 years. (18) Some of the latest Antarctic research says that only the best case scenario (RCP2.6), where CO2 is limited to 390 ppm (we are 400 ppm today), would keep Antarctica’s contribution to sea level rise less than three feet. In their press release, the principal investigator says the last time CO2 levels were similar to today’s was 3 million years ago and sea level was 66-feet higher. Their work showed, because CO2 is already higher than the best-case scenario, warming in the next 20 years will determine how much of this 66 feet we will experience. (19)
New Antarctic sediment cores show the same ice rafted sand and gravel layers associated with abrupt change as were delivered by iceberg armadas to sediments in the North Atlantic. (20) This research says that about 6,000 to 7,000 years ago Earth reached its peak post-ice age temperature, known as the Thermal Maximum.
Back then, warm ocean waters melted the bottom of the floating part of the West Antarctic Ice Sheet (WAIS). This exposed a high ridge (grounding line) around much of Antarctica that acts like an ice brake – slowing the flow of ice to the sea – and allowed warm water to penetrate much farther beneath the ice sheet. (21) Since the Thermal Maximum, earth has cooled a degree or 2 Celsius and the ice sheet reconnected with the grounding line, up until recently.
Recent ocean warming is melting the bottom of the perimeter of the exposed parts of the ice sheet and producing conditions similar to those during the last Antarctic iceberg pulse during the Thermal Maximum. Warm water can now flow in under the ice sheet and create what has been observed in Greenland as 100 times more melt below than above. (22)
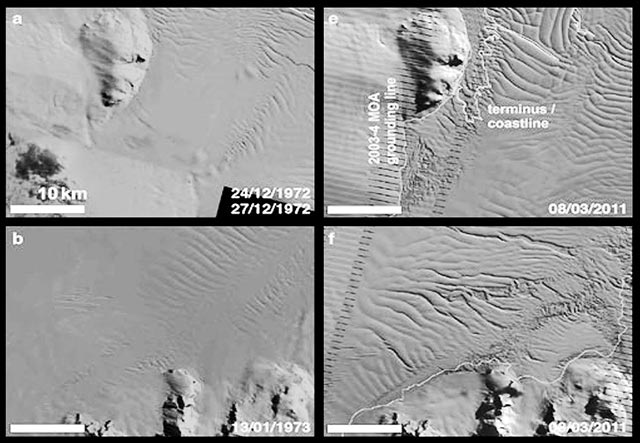 Crosson Glacier, Amundson Sea Embayment, West Antarctic Ice Sheet. The glacier emptying into the Amundson Sea Embayment drain a third of the Mexico sized West Antarctic Ice Sheet. Rifting shown in these satellite images is the likely precursor to collapse of this area. (From MacGregor 2012)
Complicating Antarctic’s situation, fresh water from already increased iceberg discharge has formed a freshwater cap around Antarctica that floats on the denser salt water allowing more sea ice to form as freshwater freezes at about 3 degrees Fahrenheit warmer than salt water. More sea ice decreases ocean turbulence, meaning that mid-level waters are warmer, enhancing underice melt. Rifting, a predecessor to collapse, is significantly increasing in the Amundsen Sea Embayment and is visible in satellite imagery. The Amundsen Sea Embayment drains 30 percent of the West Antarctic Ice Sheet, has increased in flow 33 percent in the last 40 years, and is currently responsible for 10 percent of annual sea level rise. (23)
The quickest ice sheet collapse projection today is in the multi-century range, but it is very important to understand that ice sheet collapse modeling is still in its infancy and likely underestimates the speed of collapse once protective ice shelves, discharge glacier tongues have collapsed and the bottom of the ice has melted up off of grounding lines. Evidence for a previous collapse about 120,000 years ago at a reef called Excaret on the Yucatan Peninsula, when our CO2 concentration was 25 percent less than today, found a six- to 10-foot rise in sea level that happened in 100 years or less. (24)
Other new research from Antarctica that demonstrates the possible underestimation of the speed of collapse shows that in 2002, the Rhode Island sized Larsen B ice shelf disintegrated over a two-month period. The Larsen C, the size of Vermont and New Hampshire combined, appears like it to is about to undergo major changes or disintegration. In 2015, two separate lines of research from the British Antarctic Survey and German Institute for Polar Research found that this was likely and imminent. (25)
Submarine Glacial Valleys in Greenland
Researchers at the University of California and California Institute of Technology have discovered that land beneath Greenland is not at all what we had previously believed. The center of Greenland is still depressed below sea level like we have known before, but higher powered radar has allowed us to see finer resolution around the edges. This research found submarine bed channels beneath the ice that are 10 times more widespread than previous work shows, and that extend 50 percent farther inland (90 miles) than previous work in 2013 and 300 percent farther than 2001 work.
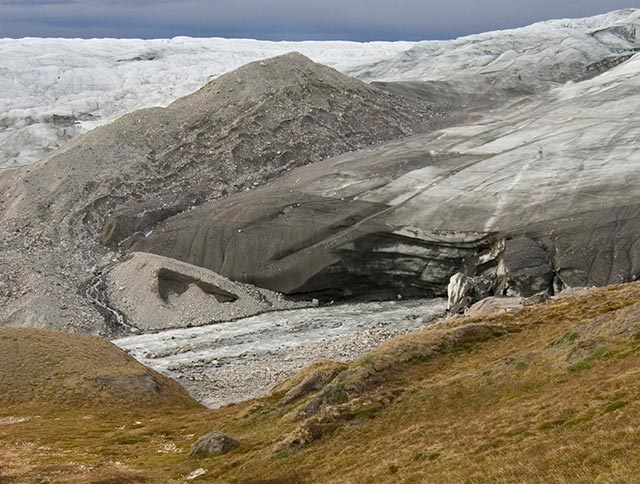 An underice river emerges near the west cost of Greenland ice sheet at Point 660, near the Arctic Circle. (Photo: Bruce Melton)
Sixty of the glaciers overlying these submarine valleys drain 88 percent of the ice sheet and are more than 1,000 feet deeper than their glaciers: “meaning they are deep enough to interact with subsurface warm Atlantic waters and undergo massive rates of [underice] melting.” This research concludes: “These results will have a profound and transforming impact… reveal[ing] a more pervasive influence of [underice melting] on these glaciers, which is more consistent with the past two decades of satellite observations.” (26)
The Thermal Maximum: As Warm as 120,000 Years Ago
Tiny ice caps on Baffin Island just west of Greenland have been melting on average over 30 vertical feet per year since; what climate scientists are calling “The Big Melt” began about 2,000 years ago. Scientists have been dating rooted plant remains from the dripping edges of the melting mini ice caps and found that the earliest that ice covered the oldest of them was at least 51,000 years ago when Earth was receiving 9 percent more incoming heat from the sun than today.
But the plants are a lot older than that, because 51,000 years ago was in the middle of the last ice age. The principal investigator, Giff Miller from the Institute of Arctic and Alpine Research, University of Colorado, Boulder, says that the youngest time interval from which summer temperatures in the Arctic were plausibly as warm as today is about 120,000 years ago. Miller is quoted in the American Geophysical Union Journal: “Although the Arctic has been warming since about 1900, the most significant warming in the Baffin Island region didn’t really start until the 1970s, and it is really in the past 20 years that the warming signal from that region has been just stunning. All of Baffin Island is melting, and we expect all of the ice caps to eventually disappear, even if there is no additional warming.” (27)
Baffin Island is the fifth largest island in the world after Greenland. It is located west of southern Greenland in Ninuvit, Canada. The most rapidly melting fringes of northern ice here have been receding by as much as 100 feet every three years since about the turn of the century.
The most astounding part of this research, though, is that some of the plants reemerging from the ice have begun to grow again.
Final Thought
The ancient plants that have begun to grow again on Baffin Island are emblematic of the promise of new direct air capture technologies. There is no known way, as the IPCC says, to make a “large net removal of CO2 from the atmosphere” without using direct air capture. These technologies offer a promise, but we must continue doing everything we know how to do to mitigate for the impacts of climate change and reduce greenhouse gas emissions because right now, everything helps.
Note: For detailed references, click here.
Join us in defending the truth before it’s too late
The future of independent journalism is uncertain, and the consequences of losing it are too grave to ignore. We have hours left to raise the $12,0000 still needed to ensure Truthout remains safe, strong, and free. Every dollar raised goes directly toward the costs of producing news you can trust.
Please give what you can — because by supporting us with a tax-deductible donation, you’re not just preserving a source of news, you’re helping to safeguard what’s left of our democracy.