
With president-elect Donald Trump and his army of climate deniers preparing to take office, it could be a hard battle to get the US to adhere to any sort of climate policy anytime soon. This is hard news because today’s suggested but nowhere-implemented climate policy was already much less restrictive than the climate policy from the mid-1990s. In a world where we have emitted as much carbon dioxide since 1987 as was emitted in the previous 230 years, why has policy not become more stringent? This outdated emissions reductions policy has earned the title “legacy,” not because it is worthy of recognition, or something we want to pass on to future generations, but because it is like “legacy software,” in that “it is difficult to replace because of its wide usage.”
The climate policy strategy that we are attempting to implement in the face of Trump’s intransigence is conceptually similar to what we were supposed to adopt with the Kyoto Protocol back in the 1990s. That is, it involves a reduction of annual greenhouse gas emissions. The two relevant actions that we are now struggling to implement are the Clean Power Plan (CPP) and Obama’s Paris Climate Conference commitment. The CPP is still not implemented and has been sent back to District Court for further litigation. On paper, its emissions reductions are a fraction more restrictive than the initial Kyoto targets but overall, the CPP is significantly less restrictive than Kyoto because Kyoto targets were supposed to have been achieved in 2012. The CPP pushed the deadline back 18 years to 2030.
Obama’s Paris commitment in 2015 is even further behind. Kyoto Phase 2 targets were 80 percent below 1990 by 2020. Obama’s are 80 percent below 2005 by 2050. This is 30 years behind and 30 percent less stringent. Kyoto, of course, was never ratified in the United States and we have the dubious honor to be the only country in the world to not do so.
Delay Increases the Rate of Impacts
Climate science continues to make rapid advancements while policy moves in reverse. We have entered the rapidly increasing phase of climate change, in which impacts increase nonlinearly. Up until recently, we have been the beneficiary of the ecological process of pollution buffering: Our environment can soak up a lot of punishment before it begins to degrade. Now, impacts are happening faster than projected. Whether this is because of delay, or underestimating science, is vague (it’s probably both). An excellent example of this underestimation is that Antarctica has begun to lose ice a hundred years ahead of schedule.
The science has changed as we have learned more in the 20 years since we first began trying to implement emissions reductions strategies to deal with climate pollution. We know now that Obama’s Paris commitment to (very aggressive) 80 percent CO2 emissions reductions by 2050 would produce double to triple the warming we have seen already, by 2050. With impacts already increasing so dramatically, in terms of floods, drought, fires and more, why are we still attempting to implement a 20-year-old climate reform strategy?
Global Warming Psychology: Why the Delay?
The recently emerged discipline of global warming psychology lists numerous reasons “why” we do not trust climate scientists when we trust all other scientists almost implicitly. What it boils down to is something that has been labelled by Stanford research as the Climate Change Counter Movement (CCCM).
We all know what the CCCM is. It’s the fossil fuel industrial complex and its political and policy think tank allies. The Stanford researchers say they have discovered $900 million annually in identifiable, IRS-documented funding for conservative policy institutes and think tanks identified in other academic work that supports right-wing platforms that include climate science denial (and this doesn’t count money from anonymous, undisclosed sources). This incredible sum of nearly a billion dollars a year supports the entire platform of these identified conservative think tanks and policy institutes. Because this platform (focused on reduced government regulation, tax cuts, attacks on abortion rights and more, in addition to climate denial) is a part of the political machine that elects our leaders, their work to dissuade Americans of the veracity of climate science cannot be separated from their total funding, and it should not be.
The Stanford researcher offered a succinct summation of the CCCM’s effectiveness:
A well organized climate change counter-movement (CCCM) … has not only played a major role in confounding public understanding of climate science, but also successfully delayed meaningful government policy actions to address the issue. With delay and obfuscation as their goals, the U.S. CCCM has been quite successful in recent decades. However, the key actors in this cultural and political conflict are not just the “experts” who appear in the media spotlight. The roots of climate-change denial go deeper, because individuals’ efforts have been bankrolled and directed by organizations that receive sustained support from foundations and funders known for their overall commitments to conservative causes. Thus to fully understand the opposition to climate change legislation, we need to focus on the institutionalized efforts that have built and maintain this organized campaign.
Climate scientists, of course, know that the radical skepticism is invalid, and so do environmental advocates. A very significant majority of Americans, including the average conservative, believes that climate change is real and fossil greenhouse gases are responsible. But the extent of mankind’s responsibility is still poorly understood by the public, environmental advocates and even climate scientists who do not specialize in attribution of warming, or what has caused the warming.
Almost everyone but the climate scientists who are working to understand attribution misunderstand misleading claims about how some “part” of the warming we have experienced is natural. The director of the climate change attribution program at Great Britain’s national weather service tells us, in the report of the 2013 Intergovernmental Panel on Climate Change (IPCC), that less than 2 percent is natural. In other words, all of the warming we have experienced has been caused by mankind’s emission of greenhouse gases but more importantly, already-emitted greenhouse gases are responsible for 35 percent more warming than we have measured. The reason being global cooling gases (sulfates emitted mostly from burning coal) have masked a third of the warming that should have already occurred.
This myth that some part of climate change is “natural warming” is a major part of CCCM propaganda. Over the last several generations, some of the exact same people who have orchestrated the propaganda behind the debates on smoking, acid rain and ozone-depleting chemicals have now been working with the CCCM to create public mistrust of climate science.
The CCCM questions the validity of the science, the scientists’ ethics and the scientific method. Among the public, this doubt is enhanced by the fact that, as anyone who regularly checks the weather forecast knows, weather modeling has great difficulty with the three-day forecast. However, weather modeling and climate modeling could hardly be more different. Weather modeling attempts to pinpoint the exact weather on a given date and model runs are begun with data hot from global weather stations the day before, or a few hours before. Climate modeling is usually started with random weather data from years or even decades or centuries before, and hundreds or even thousands of model runs are averaged together to produce results. The CCCM cleverly uses the unknowns about climate modeling to heighten the believability of their message. Not knowing the difference between weather and climate modeling validates assertions that modeling future climate is folly.
The CCCM has also negatively impacted the veracity of climate-related journalism, taking advantage of journalists’ attempts to provide “balanced” reporting; where climate change denial is presented with equal time to valid climate science. Because only three percent of climate science findings (or less) dispute the rest of the science, standard reporting today unfairly presents climate issues to the public.
This unfairness is found in almost all reporting. At the dawn of the radio and television era, the Fairness Doctrine and the Equal Time Rule were created as regulatory mechanisms to promote fair reporting of political news and viewpoints. The resulting journalistic ethics have created what is likely the biggest single phenomenon impeding climate science communications to the public, policy makers and most climate scientists as well. It’s called the “Fairness Bias.”
Climate science is complicated, and journalists (who are generally not influenced directly by the fossil fuel industry) are constantly attempting to determine whose science is real. Because of the debate created by the CCCM, they can’t tell, so according to their ethics, they report both sides of the story equally. This has created public knowledge that is literally 25 years behind. The public today has the same beliefs about climate change as climate scientists did in 1991.
It is important to note that climate scientists are impacted by the Fairness Bias too. Most scientists today are very compartmentalized. They have an enormous amount of knowledge about very specific pieces of the climate science puzzle, but only relatively common knowledge about other pieces of the puzzle. Paleo-marine chemists can hardly be expected to have a researcher’s grasp of ice sheet hydrology. These specialists then must get the bulk of their non-specialist knowledge from the media, like the rest of the public.
2 Degrees C: Why So Much?
The roots of our current climate policy are clearly part of the challenge of climate reform. The work that first defined impacts relative to warming targets began in 1987 at the Stockholm Environmental Institute, and was a part of the preparation for the first IPCC report in 1990. Basically, their task was to define, “How do we know when climate change becomes dangerous?” They have left us with this knowledge: “Beyond 1.0 degree C may elicit rapid, unpredictable, and non-linear responses that could lead to extensive ecosystem damage. An absolute temperature limit of 2.0 degrees C can be viewed as an upper limit beyond which the risks of grave damage to ecosystems, and of non-linear responses, are expected to increase rapidly.”
The wording for greater than 1 degree C warming, “rapid, unpredictable, and non-linear responses,” definitively defines abrupt climate change. Abrupt climate change, however, has never been a part of IPCC report projections to any degree beyond caveats that findings in the IPCC reports may be more extreme due to rapid, unpredictable and non-linear responses.
Why, then, was 2C chosen as the appropriate limit if 1C was the gateway to abrupt change? Warming more than 2C would have “grave” impacts, meaning that between 1 and 2 degrees C of warming would approach the “grave” threshold. Now that weather extremes have increased so dramatically with only about a third of the warming suggested for the 2C limit, “grave” takes on a new meaning.
Case for 0 Degrees C Warming: West Antarctic Ice Sheet Collapse
Some of the most important climate science that has ever been published is now adding to the knowledge base about what is likely the single most important thing in our new climate trajectory. For the first time, in November 2015 in the Proceedings of the National Academy of Sciences, science defined the tipping point between a stable West Antarctic Ice Sheet (WAIS) and an Antarctica that collapses uncontrollably.
What these researchers from the Potsdam Institute of Climate Impact Research tell us is that if we do not return our oceans to their preindustrial temperature by 2050, we will see out-of-control collapse of the WAIS and ultimately all of Antarctica. Their different scenarios all point to one critical issue: ocean warming. Four scenarios resulted in no collapse, all returning upper ocean warming around Antarctica to its preindustrial temperature by 2050.
The critical part of this research deals with the time remaining until collapse. Traditional ice sheet collapse dynamics (modeling physics) are used and their collapse time frame is little different from what is supported by the consensus.
Because of scant research and slow (10-year) integration of new research into IPCC projections and modeling, consensus projections are based on simple ice-cube melt and iceberg discharge relationships that have been observable in the historic record. Science is just slow (relatively speaking, of course). When speaking of the speed of ice-sheet collapse science, Margaret Davidson, the National Oceanic and Atmospheric Administration’s (NOAA) senior leader for Coastal Inundation and Resilience Science and Services program says it can take nearly a decade to get from data collection to consensus opinion. The Antarctic ice loss example above shows it can take even longer.
The IPCC caveats their sea level rise projections heavily with cautions that “dynamical collapse mechanisms” are not included. This new research that NOAA speaks of is exploring these dynamical collapse mechanisms. The traditional “ice-cube melt” model is based on historic observations, and melt and iceberg discharge today are very slow compared to maximum rates in the ancient past. But because we have no direct record of these abrupt changes, and traditional modeling could not recreate them, they are not included in the consensus opinion. This is the reason for the great disparity between IPCC’s 4 mm per year worst-case sea level rise from Antarctica and evidence from Xcaret Reef 121,000 years ago of 36 mm per year, or the large body of science that shows rapid ice sheet collapse and sea level rise in prehistory of 10 feet per century (30 mm per year) for centuries on end.
Abrupt sea level rise is a vastly different creature from simple ice-cube melt. The research that NOAA is referring to when they say “it can take nearly a decade to get from data collection to consensus opinion” will reveal a 10-foot rise in sea level by 2050. It is also worth noting that in the last five years, NOAA’s sea level rise data looks to have jumped from its 3 mm per year level to 5 mm per year or greater. This could be a natural fluctuation, but given the circumstances that it is the largest jump in the satellite record it is important to keep in mind.
Dramatic new discoveries about the WAIS were published in Nature in March 2016 by Robert M. DeConto, University of Massachusetts Amherst and David Pollard, Pennsylvania State. These researchers break through the ice cube melt modeling barrier with work that has begun to approach ancient evidence of ice sheet collapse. They predict three feet of rise from Antarctica alone by 2100, which is nine times faster than the consensus opinion of the IPCC of four inches by 2100 (9 mm per year vs. 1 mm per year).
But actual evidence of 30 to 36 mm per year and more discussed above is many times faster than DeConto and Pollard’s 9 mm per year and critically, the maximum sea level rise adaptation rate is 3 feet per century (9 mm per year). But DeConto and Pollard show 9 mm per year from Antarctica alone. These two researchers have opened a new door that is fundamental to current climate reform strategy. Their methods use refined physics not yet modeled before and the most fascinating is ice cliff collapse.
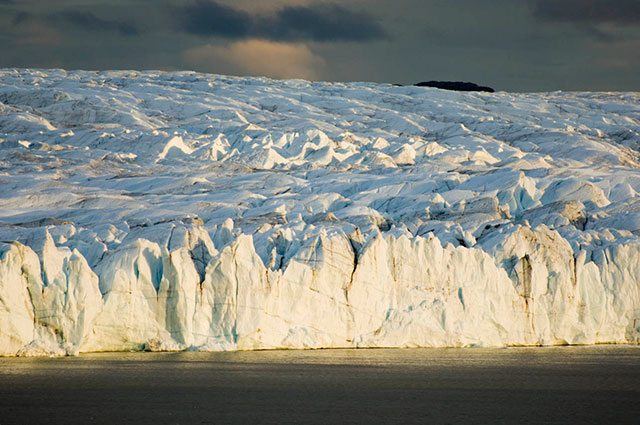 A 200-foot high ice cliff on the Russell Glacier in Greenland. Where ice sheets and glaciers terminate in water, their height is limited to 200 to 300 feet because the ice is simply too weak to hold itself up at greater heights. (Photo: Bruce Melton)
It seems that when an ice cliff becomes taller than about 300 feet, it does not have enough strength to hold itself up and collapses. This is an easily observable phenomenon if one can travel to the face of an ice sheet or glacier terminating on water. The ice cliffs in these areas are never higher than 200 to 300 feet.
With the WAIS in Antarctica, where we have the only marine ice sheet remaining in the world (an ice sheet with its base below sea level), the ice sheet rises 6,000 feet above the level of the ocean 500 miles inland. The foot of the ice sheet lies on the ocean floor up to 5,000 feet below sea level. At its ocean edge for 1,000 miles along the Ross and Ronne Ice Shelves and places like the Amundsen Sea Embayment, the ice thins to a floating sheet that rises only 200 to 300 feet above the sea. With scientists now warning (since 2008) that collapse of the West Antarctic Ice Sheet has begun, this could radically change.
 DeConto and Pollard’s schematic representation of ice retreat triggered by ocean and atmosphere warming. For a larger image and detailed explanation click here. (Credit: Robert M. Deconto and David Pollard / Nature)
Most of Antarctica is still far below freezing, but the oceans are warming, particularly the upper oceans around Antarctica. Interestingly, increased sea ice in Antarctica, because of increased winds around Antarctica due to warming, is increasing upper ocean warming even more than atmospheric warming alone.
The stronger winds caused by a warmer Earth blow young sea ice out to sea and new ice quickly forms. This increase in the area of sea ice coverage decreases ocean mixing from wind and cools the ocean less than otherwise. The increasing record levels of Antarctic sea ice coverage are enhancing this feedback effect.
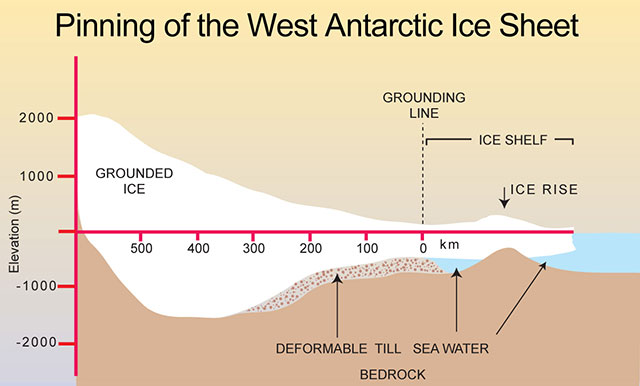
Warmer upper ocean water circulates beneath the floating shelf of the WAIS. The warm water has already melted the edge of the WAIS up above its sill, or its underwater pinning point. Think of this pinning point as a ridge that has been raised upward because of the great weight of the Antarctic Ice Sheet. The ice sheet functions like a giant medicine ball plopped down in a muddy field, and the mud around its edges rises in a ridge around the medicine ball.
In our old climate, this ridge protruded up into the bottom of the floating ice shelf with water on both sides, holding back the flow of ice outward from the interior. Today’s warmer ocean has melted the bottom of the ice shelf up high enough so that it has lost contact with its pinning point. Outward flow has increased significantly, in some places dramatically. Just as important, warm ocean water is now flowing far back into the previously inaccessible reaches of the under-ice ocean. At the most extreme measured so far, under-ice melt is in excess of 100 meters per year.
 This image from Michael Oppenheimer’s article in Nature displays a visualization of the underside of the West Antarctic Ice Sheet (WAIS) in 1998. Today the underside of the WAIS has melted up away from pinning point in critical areas, allowing for unhindered ice flow and greater warm ocean water circulation beneath the ice. (Credit: Michael Oppenheimer / Nature)
According to DeConto, their collapse estimate is likely conservative:
We are imposing a “speed limit” on the cliff collapse mechanism, that could indeed be conservative — especially for cliffs much taller than 100m (which will exist in some places as the ice margin retreats landward). For example, the retreat rate at the face of Jakobshavn glacier in Greenland is greater than10km/yr, and that’s up in a long fjord choked with ice — with limited communication with open ocean. These cliff margins in Antarctica would be much broader — and will not become as easily choked with melange/bergs. The rate of retreat in the model ensembles maxes out at around 3km/yr — much slower than Jakobshavn. With that said, we could be missing some important negative feedbacks in the rate of retreat (I hope we are). We still have a long way to go in representing these physics in the models.
The Bottom Line
As time moves forward, what we know changes. Knowledge is rarely static. Climate policy we are currently attempting to implement is based on science that is 20 years old. Most climate science has been found to underestimate, especially consensus statements about climate science. Ample evidence exists that policy needs to change. We have spilled climate pollution unknowingly into our sky and if this were any other type of pollution, we would have already cleaned it up. Shouldn’t we be cleaning up all of the inadvertently released climate pollution and be returning our climate to a healthy state instead of one that, as the basis for the 2C warming threshold states: “can be viewed as an upper limit beyond which the risks of grave damage to ecosystems, and of non-linear responses, are expected to increase rapidly”?
Note: Detailed references for the claims in this article can be found here.
Join us in defending the truth before it’s too late
The future of independent journalism is uncertain, and the consequences of losing it are too grave to ignore. To ensure Truthout remains safe, strong, and free, we need to raise $17,000 by midnight tonight. Every dollar raised goes directly toward the costs of producing news you can trust.
Please give what you can — because by supporting us with a tax-deductible donation, you’re not just preserving a source of news, you’re helping to safeguard what’s left of our democracy.